![]()
![]()
![]()

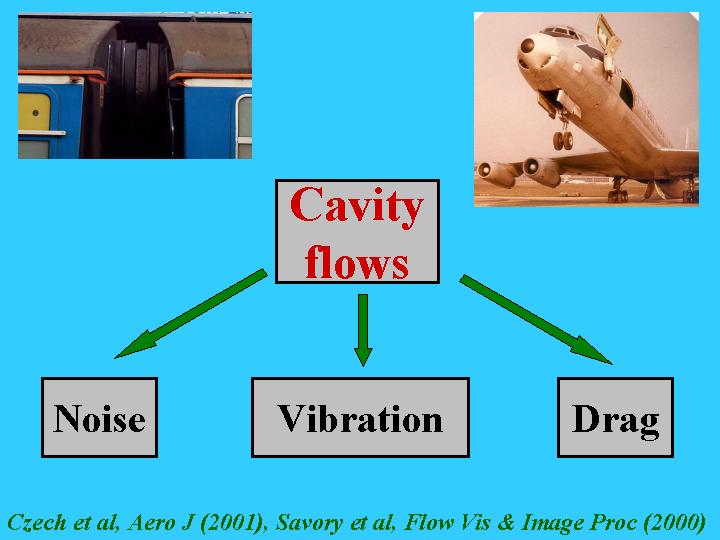
The flows over and within cavities or surface cut-outs is of relevance to many branches of engineering, ranging from the small cavities due to gaps in the body work of vehicles and the variable roughness of river channel beds, through open weapons and cargo bays on aircraft, to the larger scale flows in urban street canyons.
This page shows some results from studies of the flows in rectangular planform cavities where the flow is yawed to the cavity principal axis. The measurements carried out have included mean and unsteady pressures, together with flow visualisation. Comparisons have also been made with CFD predictions.
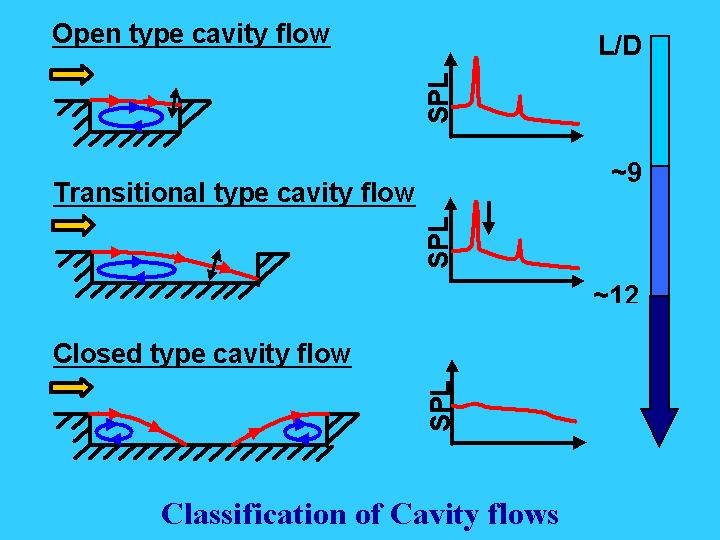
For nominally 2-D rectangular cavities, the flow may be classified as "open", closed or transitional, depending on the cavity streamwise length to depth ratio (L / D). Open flow regimes exhibit distinct peaks in measured sound pressure spectra, whilst the closed cavity signals are more broadband.
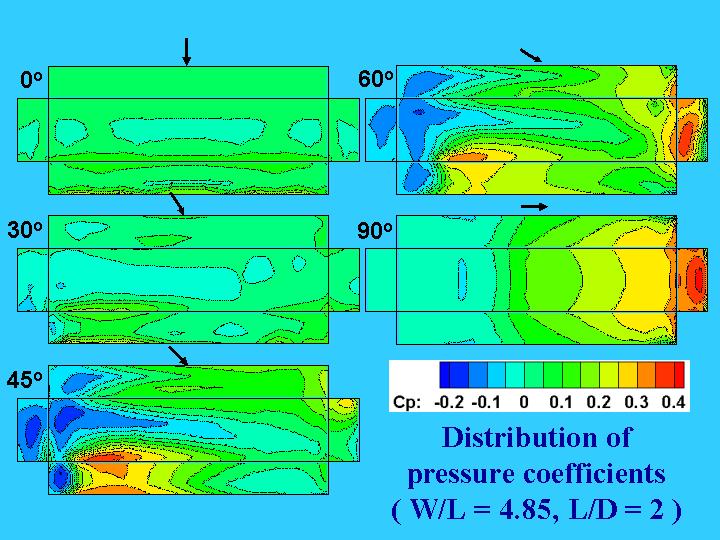
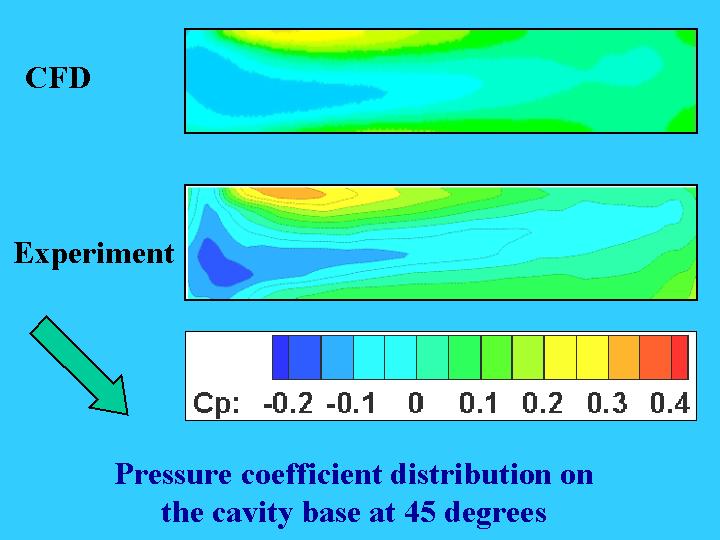
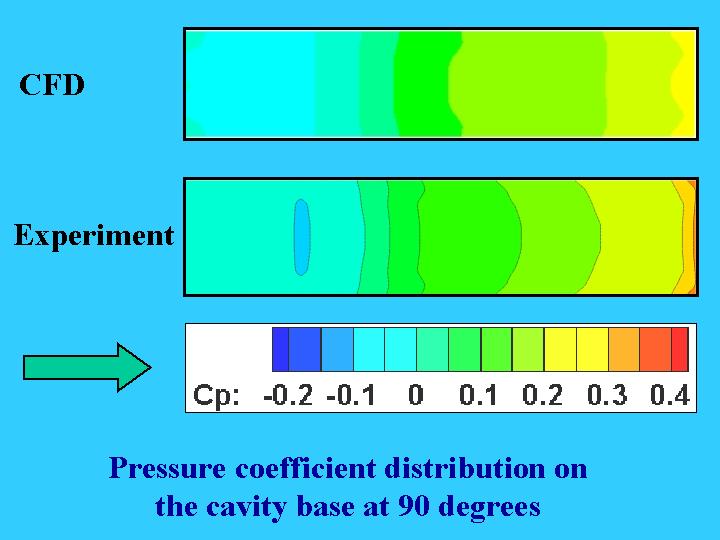
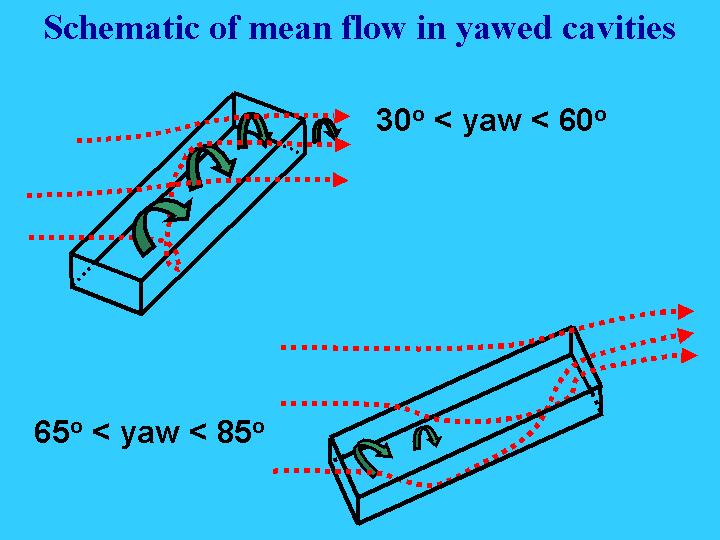
As a cavity is yawed there are distinct changes in the flow pattern, the wall and base pressure distributions and overall drag (a typical example of the mean pressure coefficient, Cp, distributions is shown below, where red are the highest positive pressures and blue represents negative, or suction, pressures).
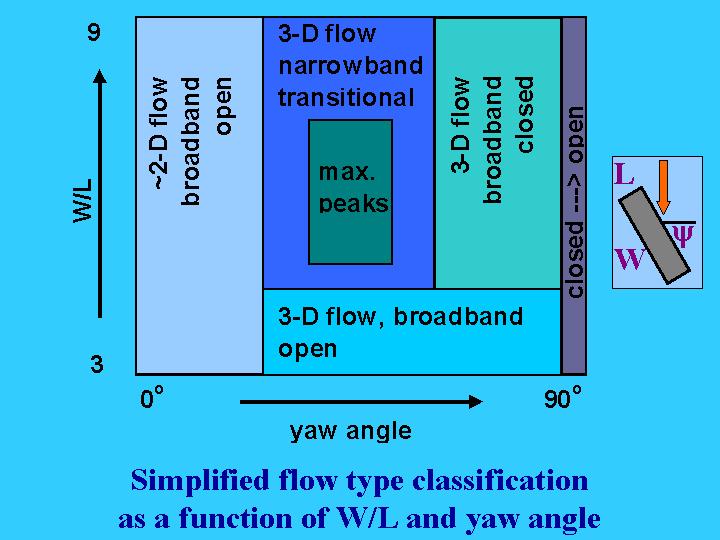
Detailed studies for a range of cavity geometies, of different Length, Width (W) and Depth has allowed an extension of the categorisation of 2-D cavity flows to 3-D planforms.
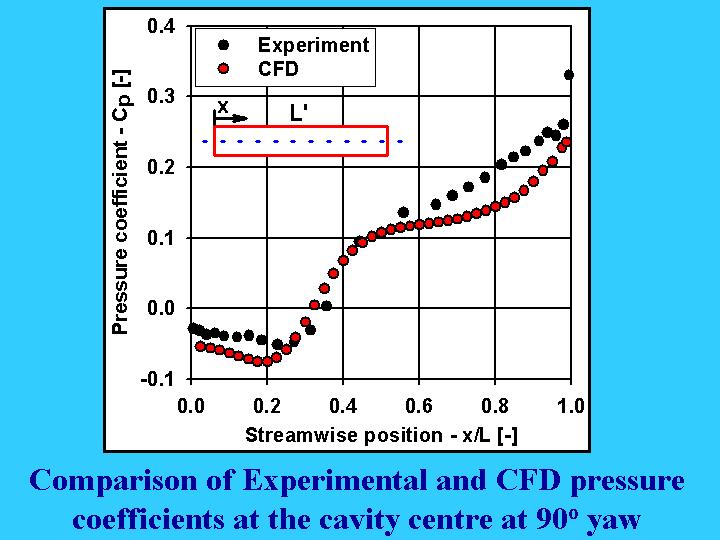
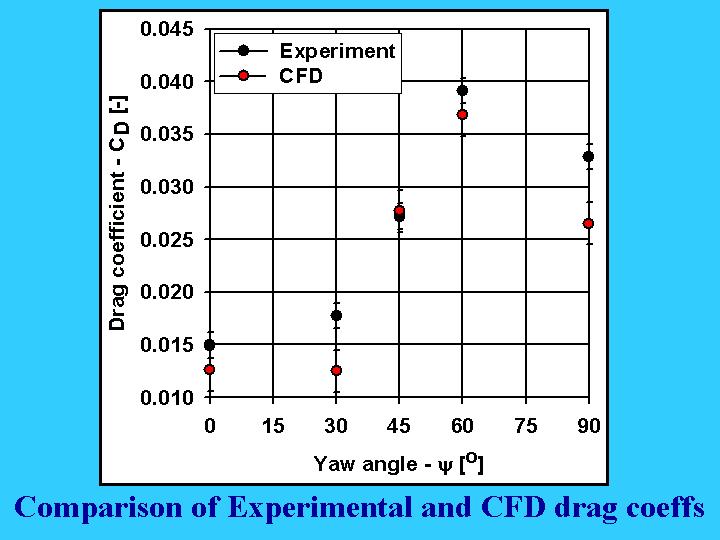
Some comparisons between the mean flow pressure coefficients and overall cavity drag have been made with CFD predictions using the FLUENT code. The results show generally good agreement.
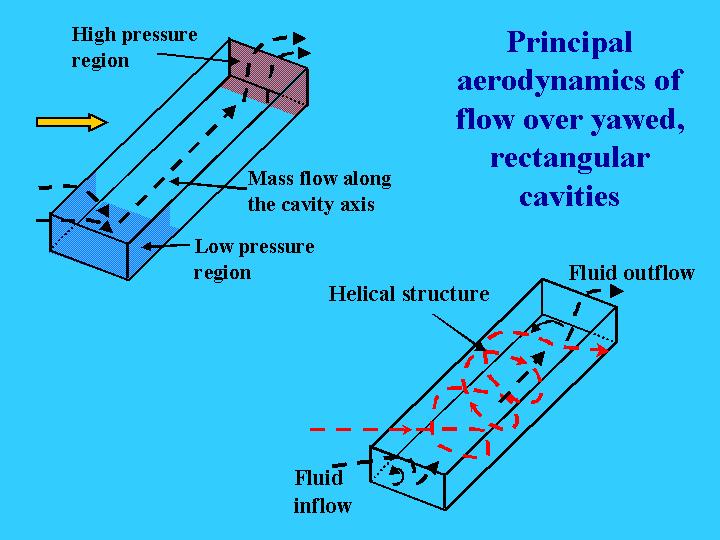
The measurements, CFD predictions and flow visualisation studies have allowed an interpretation of the basic flow field and how it changes with yaw angle.
The overall conclusions from the work are:
| Strong changes occur in the cavity tone magnitudes and drag coefficient with changes in yaw angle (also dependent on depth and width). | |
| Peak tone magnitudes occur at 45o, whilst the drag coefficient is at its maximum at 60o. | |
| There is good qualitative agreement between the mean pressure field and drag coefficient computed from CFD and those obtained in the experiments. | |
| Vorticity shedding is suggested as the physical source of the strong tones observed. | |
| Cavity tones may arise from both an aerodynamically or acoustically dominated source. | |
| Shallower cavities show the highest flow instabilities at lower yaw angles. | |
| Normal depth mode resonance is observed in deep cavities. | |
| "Open" and "closed" flow terminology may also be applied to yawed cavities. |
Acknowledgements: Dr M Czech, Prof N Toy, Mr T Mavrides, Prof S Okamoto, Prof P J Disimile, Mr L Gaudet